I left Reddit much too late. I guess some habits can be hard to break. Then I spent some time on kbin/mbin/fedia, and I’ll be staying here.
Btw I’m a non-binary trans person [they/she/he].
- 88 Posts
- 148 Comments


Thank you for pointing that out, this part really does not make any sense. Not to sure what I had in mind, so I thought of making an edit with a strikethrough so that the sentence does make sense.
To be honest, I don’t know who’s in the right here, …
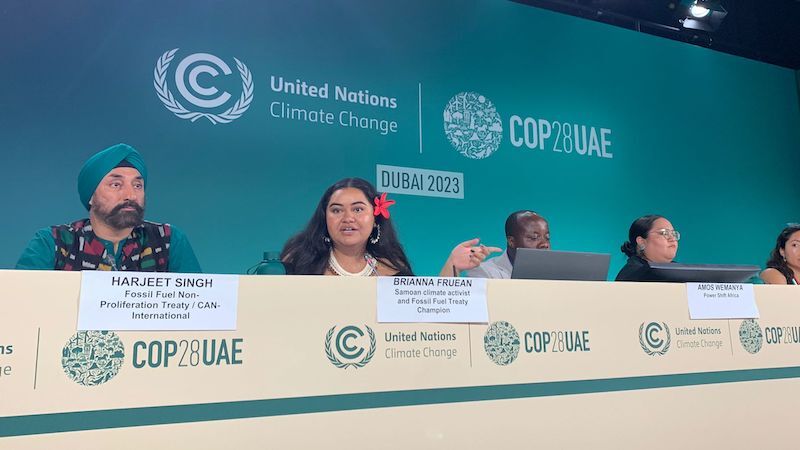
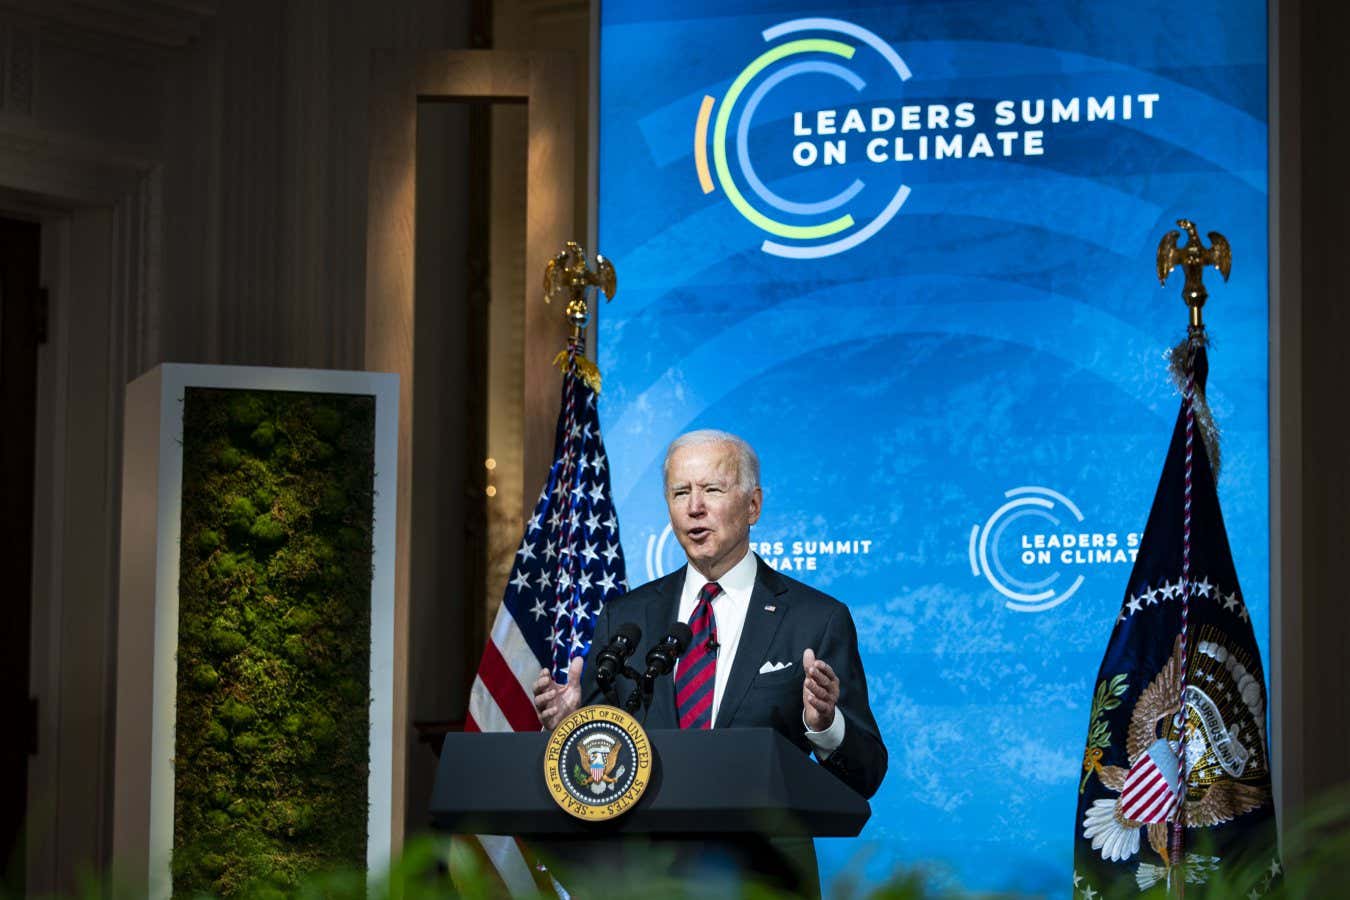
The way I see things, it’s pretty clear. In the global south are the countries that suffer the most from the economic activities (to say the least) that come from the global north. Giving these badges to the global south NGOs is important as an effort to balance out how underrepresented these part of the world typically are, even tho they are most affected by actions of others
,namely the countries that got upset, or companies that come from there. Admittedly, I don’t expect too much out of this specific climate conference due to the intense lobbying that takes place there. I’d love to be wrong on this one and be pleasantly surprised, for sure.…but the article definitely feels like it’s taking a side, and the editorialized title makes that bias worse.
I believe it is important to accept that all media is biased, even if they try to portray themselves as neutral or objective (an easy example would be fox’s fair and balanced sloggan). So I don’t think that bias is a problem by itself, but performing impartiality totally is, and mainstream media do that for several reasons.
Still, I think a journalist or an outlet can be trustworthy, and this relies on their processes. They need to be honest and meticulous in their research (and perhaps something else that I didn’t think of right now).
Edit: The strikethrough

 3·8 days ago
Ok, tbh the understanding I got from rule 3 is that it was more flexible, in the sense that it says “may be removed”, not “will be removed”, but thank you for taking the time to clarify this.
I understand what you say about the difference of posts and comments.
Reported as a copy/paste of a Mondoweiss article
Not too sure I understand to which rule this report would be based on anyway. And btw Mondoweiss is mentioned at the very top of the article. It’s the same author, different outlets. Not a secret.
I think I see what you mean. Still, I believe the priority is for this Genocide to be stopped and Israeli people have the duty I would say, to act towards this direction. General strikes that last long can be a great tool for political pressure.
It looks like it’s a one-day strike.
I hope many people participate, so that it goes on until a permanent ceasefire is achieved.
Relevant article:
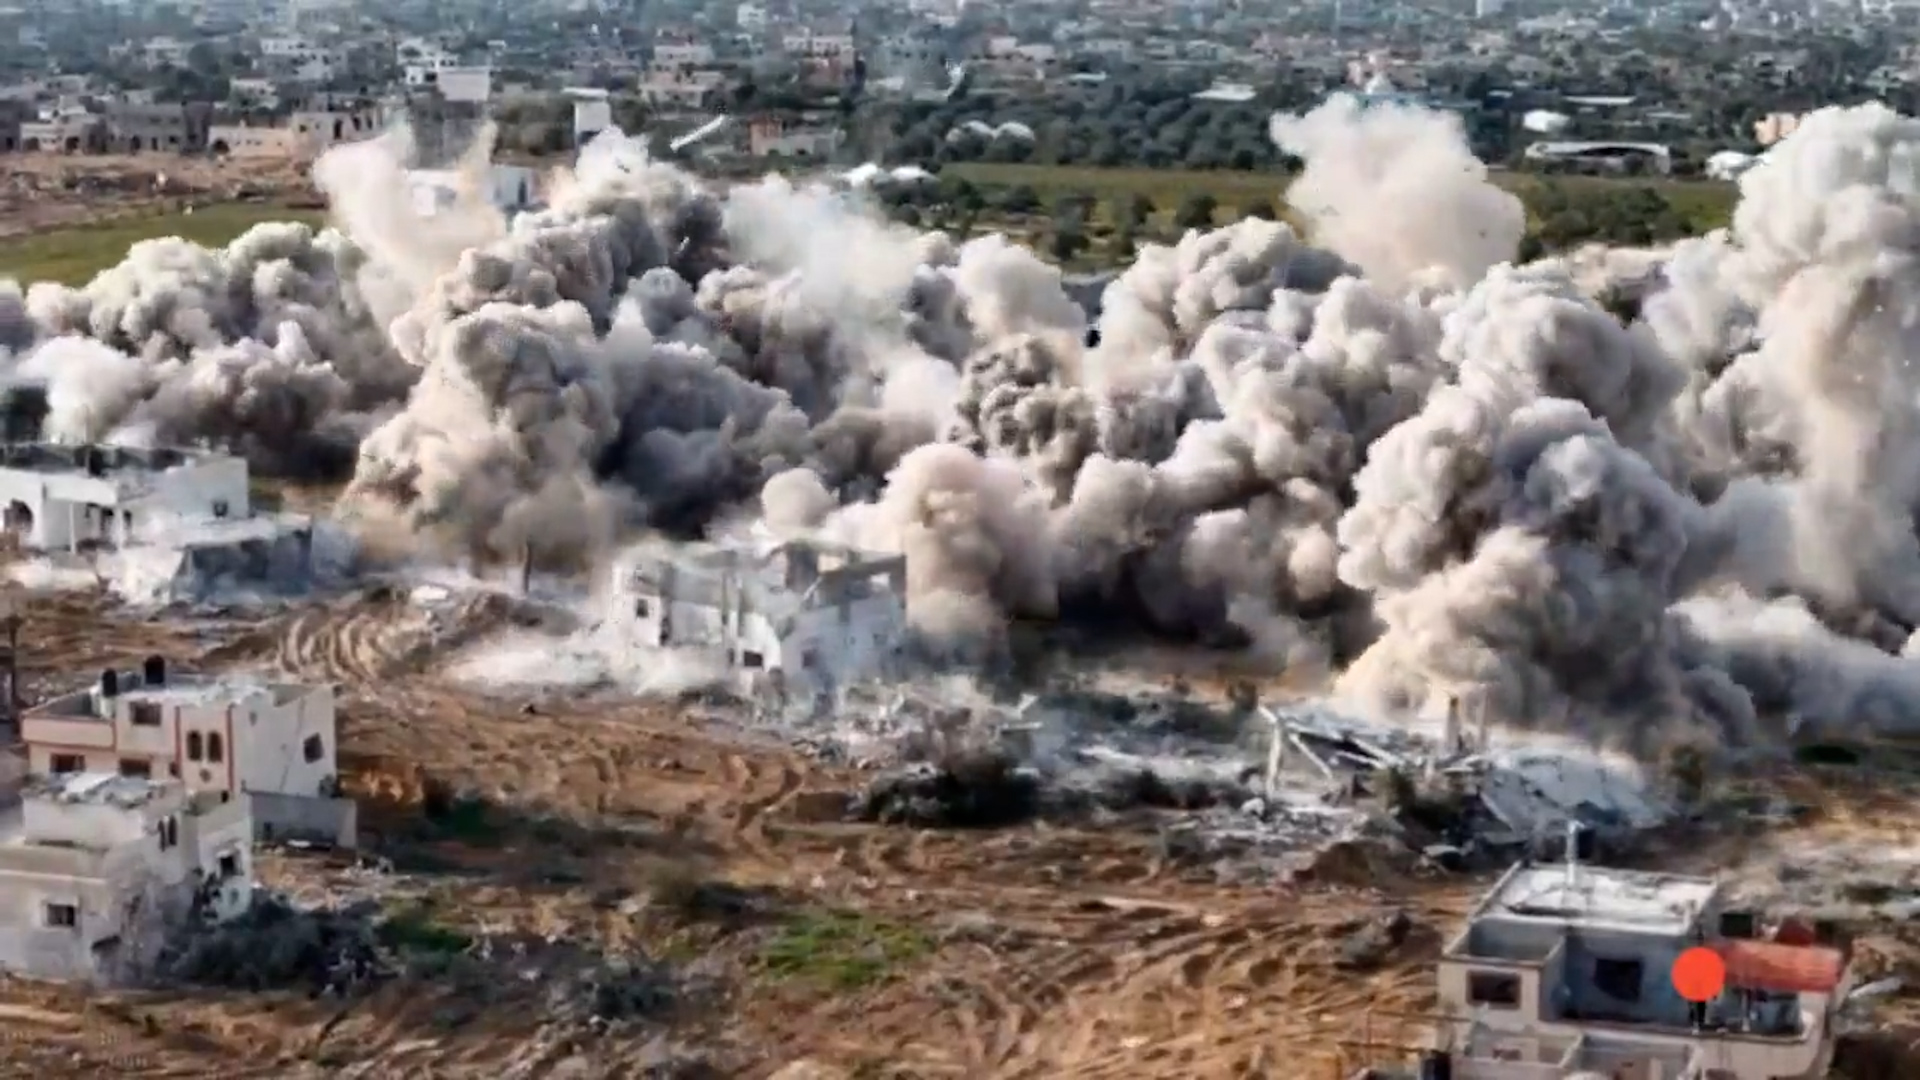
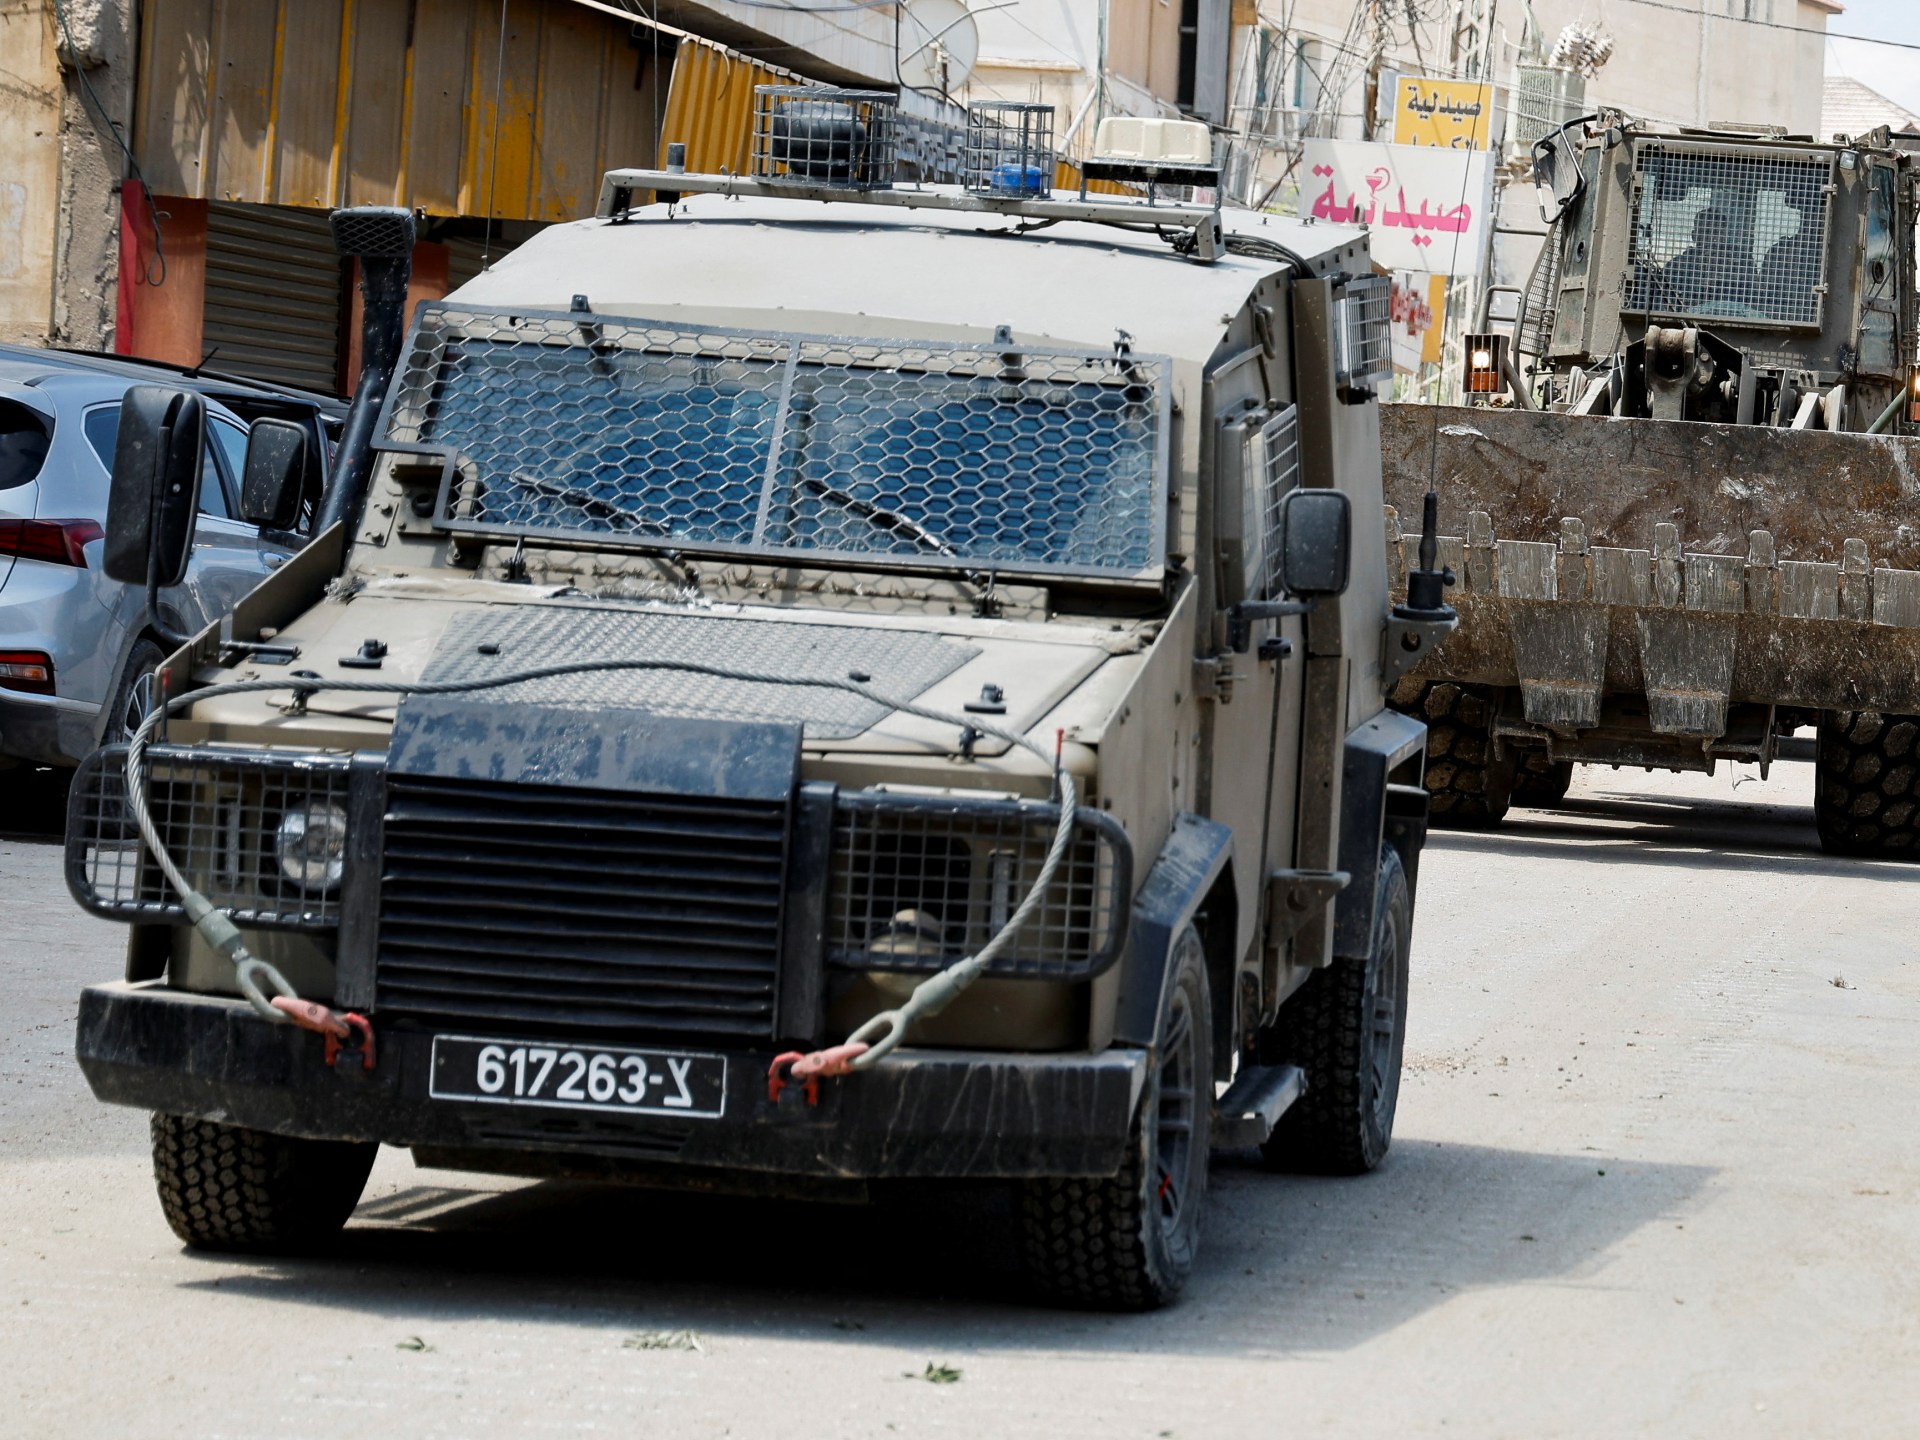
Israeli Assault on Northern West Bank Marks New Phase of Genocide
As Israel escalates attacks, Palestinians are wondering whether the war on Gaza has now expanded to the West Bank.
And another relevant article:
Google DeepMind employees ask the company to stop providing AI tech to the military
Edit: And a podcast No Tech for Apartheid w/ Mohammad Khatami & Gabi Schubiner

As I briefly explained above, I don’t see a point to this hypothetical question and I was not convinced by your arguments, so I will not engage to answering it.
It looks like we see things quite differently. For me all Genocides are evil. I believe it is important to study their differences so they do not reoccur in any way, shape or form. Obviously as humans we haven’t worked on this properly (for many of reasons) and one more is currently happening to Palestinians. In that sense comparing randomly any two of them as to see which one is worst, it honestly doesn’t make sense to me.
Do you regard the Soviets and the Nazis as equally evil?
I’m not too sure how constructive this question is. They have different characteristics for sure and this is enough for me, in terms of analysis.
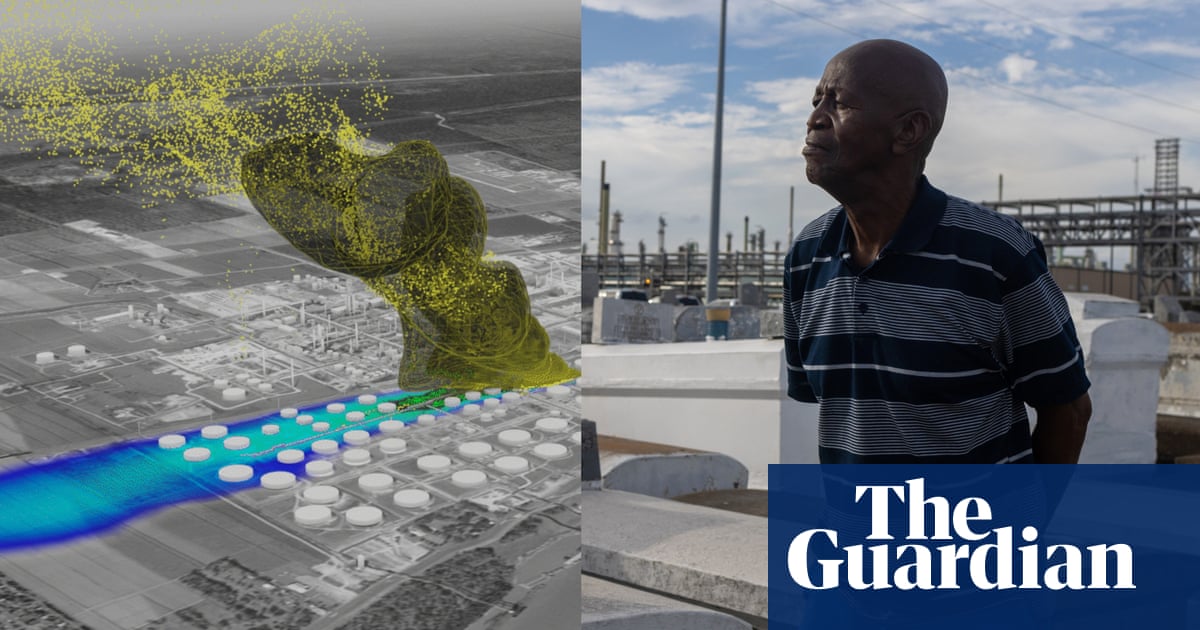
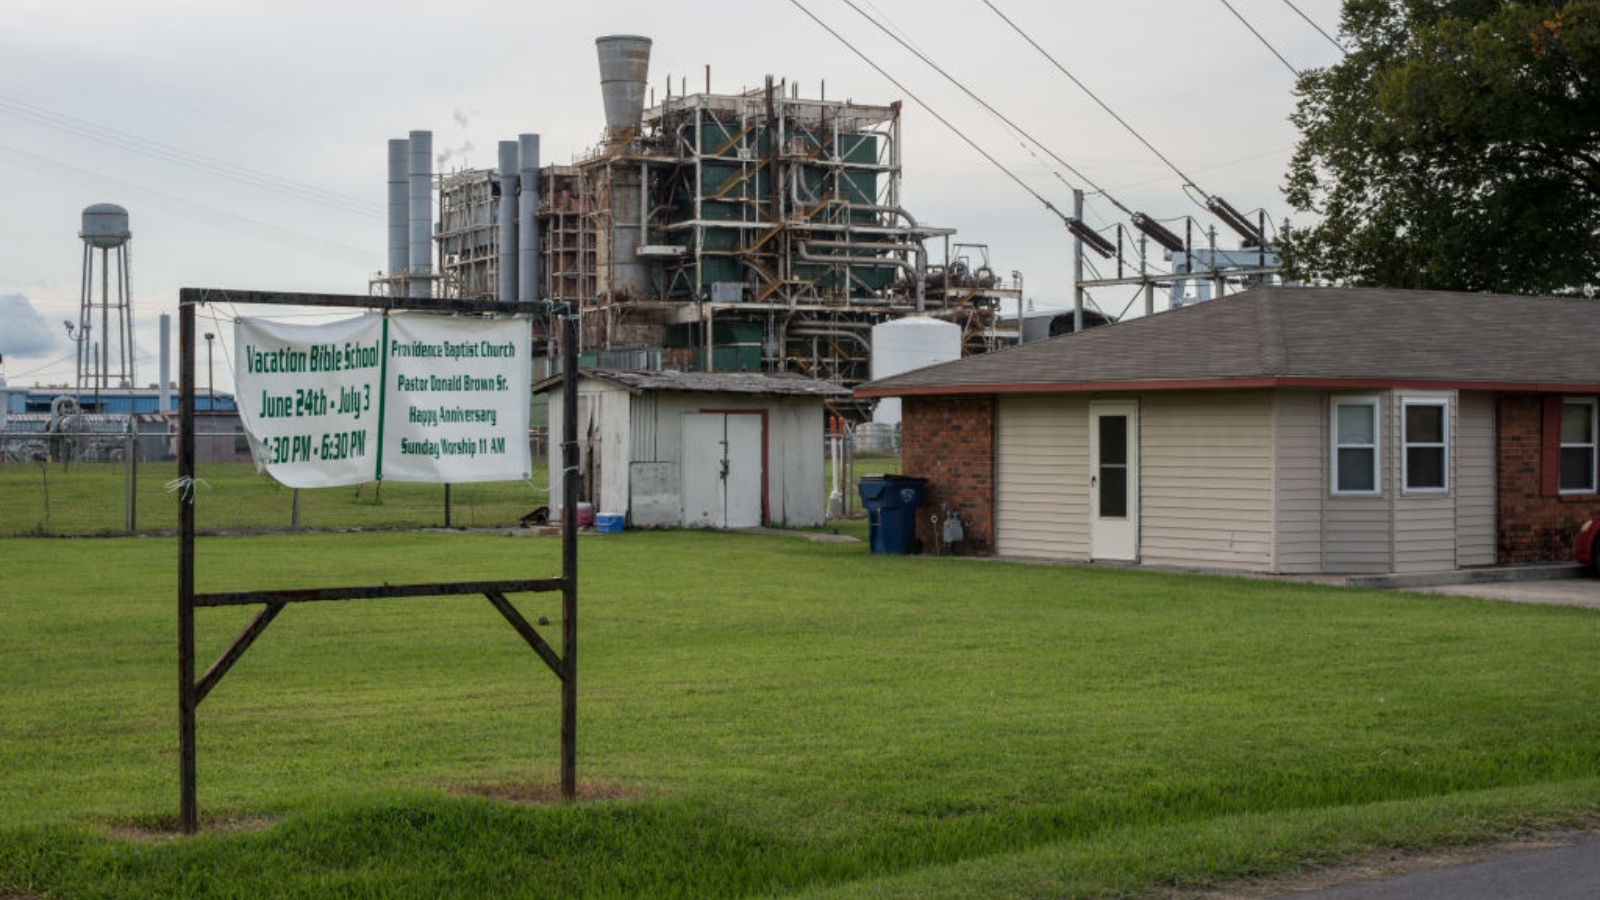
Great article, I didn’t know about this effort. I have to admit, at first it did not make any sense to me, since it took me almost half the article before remembering that gas in the US, is what is called petrol in other english speaking places, and is definitely not related to natural gas.

From the link you provided, it looks like in 2021 it was 4.2 not 7.5. Apart from that, this approach sounds too speculative to me, since the production comes from 2021 and the CO2 emissions quota from 2023. In the Drax chart it shows a decline in TWh produced from 2017 to 2021 (btw 2021 is also the year they retired coal). Still, assuming from this trend that their production few years latter continues to decline is something I would consider too risky to do.
- 2017 -> 14.9
- 2018 -> 11.7
- 2019 -> 10.2
- 2020 -> 7.5
- 2021 -> 4.2
The Ratcliffe chart has so many fluctuations till 2021 that I couldn’t dare guess what their 2023 production was.
- 2017 -> 2.6
- 2018 -> 3.2
- 2019 -> 0.7
- 2020 -> 0.1
- 2021 -> 0.8
If I find the 2023 numbers, I’ll add a comment or edit this one.
Even tho Drax uses only biomass and its CO2 emissions are 4 times higher than Ractcliffe’s which uses coal, I think it is also important to mention that Drax can produce twice as much electricity in comparison to Ratcliffe. Still terrible news from the 2023 report, just saying.
Its generating capacity of 3,906 megawatts (MW),
Ratcliffe-on-Soar Power Station
the station has a capacity of 2,000 MW
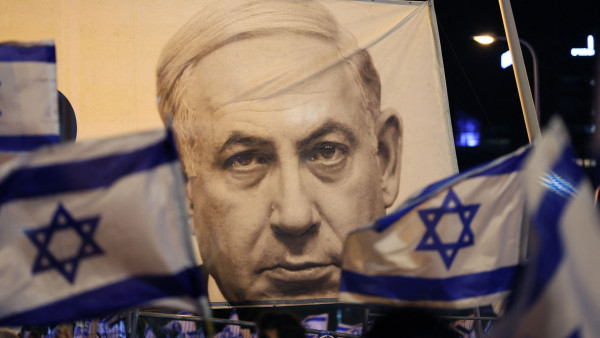
The problem is in the system that allows these people to be in power. Even if this one is out of the picture there is a list of others waiting to take their turn.

That is my understanding as well and it is more of less what the article says.
It takes two to make peace.
I think in the case of the Gaza bombings of civilians (I cannot call this a war) the two parts needed for peace are the US and Israel.
Israel has been killing hundreds of Palestinians civilians in refugee centers, schools and hospitals
Just to note that actually, it’s tens of thousands by now. Even during October Israel had already killed many thousands of Palestinian civilians.
This article does use more specific language than “southern hemisphere”, so not too sure what you mean. It also includes several links for further reading in relation to this topic.